top of page
Search


Common Claims Readings
Read more about possible ways Earth’s atmosphere could warm up.
clim856
Sep 6, 20232 min read


Mauna Loa Temperature Graph
Examine how temperature data changes when more and more data is averaged together.
clim856
Sep 4, 20231 min read


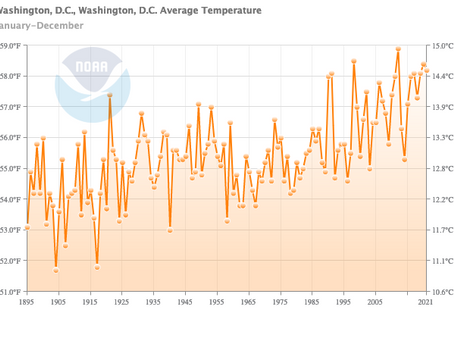
Fluctuations and Trends Graph
Analyze data on average annual temperature data for Washington, D.C., from 1895 through 2021.
clim856
Sep 3, 20231 min read


Temperature Data Explorer
Explore NOAA temperature data for 8 locations in the United States using an interactive.
clim856
Sep 2, 20231 min read


Comparing Temperature Graphs
Examine the ways scientists represent temperature data. Compare how data can be used to show short-term fluctuations and long-term trends.
clim856
Sep 1, 20231 min read
bottom of page