top of page
Search


Historical Temperature and Carbon Dioxide Graph
Examine a graph showing the relationship between carbon dioxide and air temperature.
clim856
Jan 2, 20241 min read


Mauna Loa Temperature Graph
Examine how temperature data changes when more and more data is averaged together.
clim856
Sep 4, 20231 min read


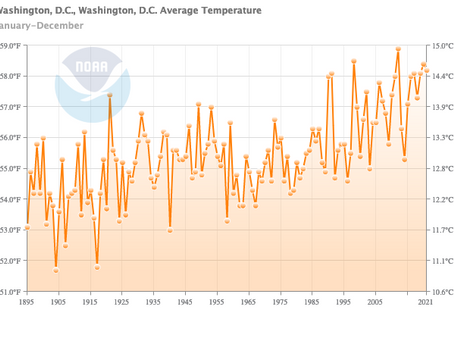
Fluctuations and Trends Graph
Analyze data on average annual temperature data for Washington, D.C., from 1895 through 2021.
clim856
Sep 3, 20231 min read


Comparing Temperature Graphs
Examine the ways scientists represent temperature data. Compare how data can be used to show short-term fluctuations and long-term trends.
clim856
Sep 1, 20231 min read
bottom of page